Happy GDPR day! We’ll have to wait and see what effect the new regulation has in practice, but I’m convinced that we as a society must do something to control limitless data collection by the richest and most powerful organizations in the world (that includes both state actors and the big Internet companies).
I applaud the EU for taking a stance, even if the end result may be flawed and may even end up strengthening the companies that already know most about us. Legislation is hard.
Regarding this site, I don’t have anything specific changes to announce, but today seems as good a day as any to talk about the data I collect on this site.
Replacing Google Analytics with Matomo is easy
I used Google Analytics on this site from March 2011 until January 2018. I’d like to apologize for this. We should all try to make it as hard as possible for Google, Facebook, Amazon & co. to track people across multiple sites/apps. Not using a centralized analytics service is an important part of this. I should have removed Google Analytics a long time ago, but I was too lazy.
When I finally took the time, switching to a self-hosted Matomo (née Piwik) installation turned out to be quite easy.
I don’t use Cookies
So I still collect analytics data, but:
- I host the data myself, so it can’t be used to track people across the web, and
- Matomo allows me to limit the data collection to a fairly non-invasive amount.
I’m mainly interested in these data points:
- How many page views/visitors I get over time.
- Which posts are the most popular.
- Where visitors come from, i.e. referring sites.
- In which countries my site is most popular.
None of this requires visitor flow tracking. It’s basically just what a typical web server log collects. I configured Matomo to anonymize your IP address and to not use Cookies, so I can’t track if you’ve been here before. My Matomo installation is also set up to respect your browser’s Do Not Track header, so the easiest way to opt out of being tracked is to enable this setting in your browser’s preferences.
Lastly, Matomo is a popular library, so I’m sure almost every ad/tracker blocker blocks it by default. And you really shouldn’t be using the web without a blocker! (Seriously, if you don’t have a content/ad blocker, get one.)
Discrepancies between Matomo and Google Analytics
I ran Matomo and Google Analytics for one month in parallel to get an idea of differences in the reporting. Pageviews reported by Matomo were about 11 % lower than Google Analytics in that period. I’m not sure where this discrepancy comes from. If anything, I’d have expected Matomo’s numbers to be higher because people are presumably more likely to block Google Analytics.
Update May 31, 2018: Emilio Pavia suggested that the lower Matomo figures may be a result of respecting the Do Not Track header. Good guess, I didn’t think of that!
The numbers
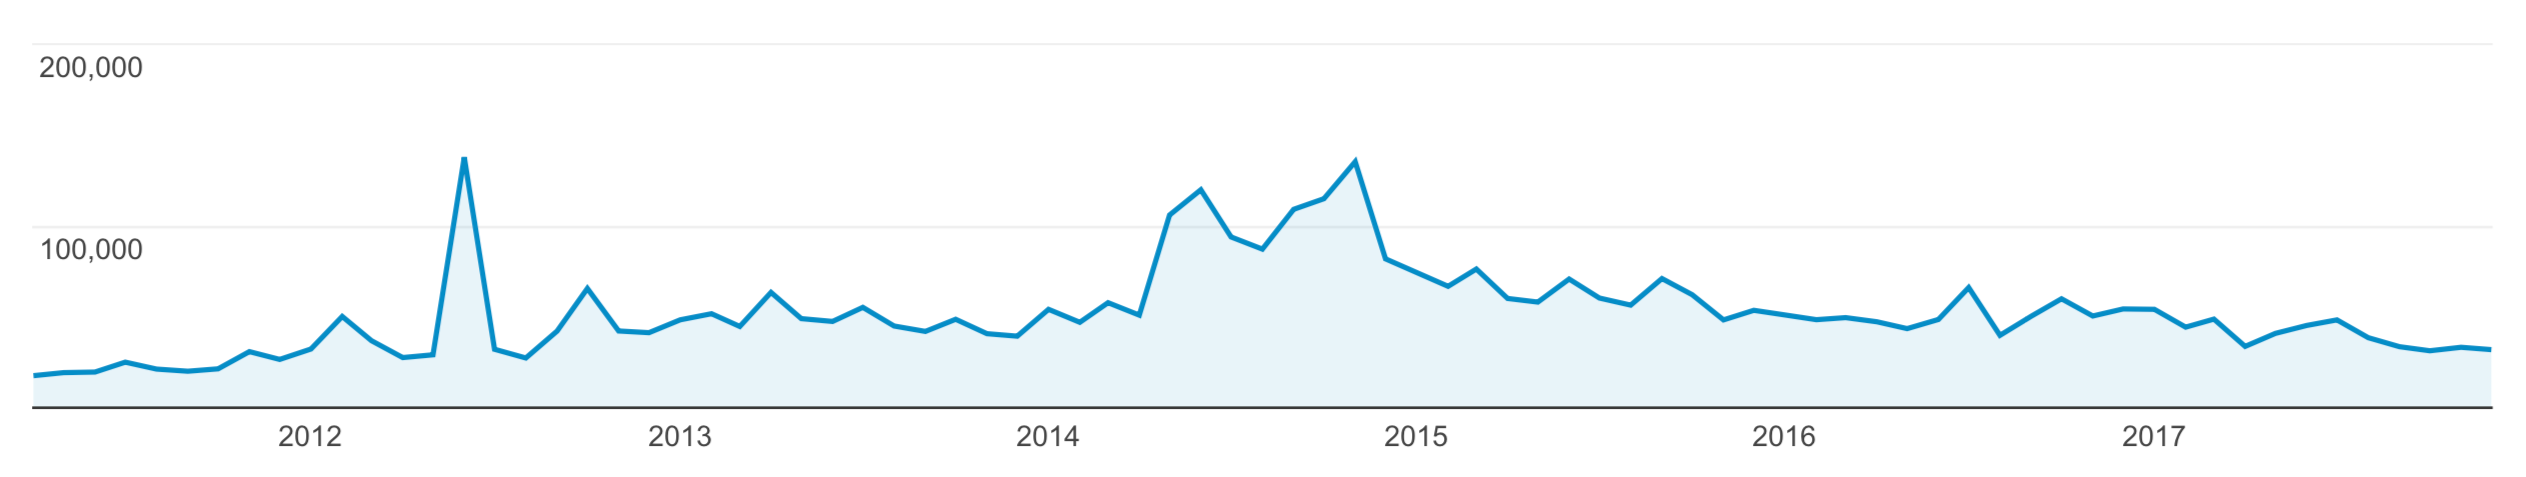
I thought it would be nice to share some of the data that Google Analytics collected over the years. (The numbers below are only from Google Analytics. They don’t include Matomo data yet.)
Pageviews per year
| Year | Pageviews |
|---|---|
| 2012 | 564,000 |
| 2013 | 575,000 |
| 2014 | 1,058,000 |
| 2015 | 758,000 |
| 2016 | 609,000 |
| 2017 | 484,000 |
2014 was clearly my most “successful” year and traffic has declined since then. I’m not sure how much (if any) of the decline can be attributed to more visitors using content blockers. Likewise, I have no idea how many pageviews aren’t being counted because people have blocked analytics scripts.
Top articles
My top posts by pageviews between Apr 1, 2011 and Dec 31, 2017.
| Article | Pageviews |
|---|---|
| Replacing Launch Images With Storyboards (2014) | 214,000 |
| 10 Things You Need to Know About Cocoa Auto Layout (2013) | 115,000 |
| How Dropbox Uses C++ for Cross-Platform iOS and Android Development (2014) | 106,000 |
| Strings in Swift 1 (2014) | 103,000 |
| The Apple Symbols Font: A Great Repository for iPhone Button Icons (2009) | 100,000 |
| Passing Data Between View Controllers (2012) | 86,000 |
| iPhone 6 Plus Pixel Peeping (2014) | 81,000 |
| Tutorial: How to Sort and Group UITableView by Date (2011) | 79,000 |
| Animating the Drawing of a CGPath With CAShapeLayer (2010) | 78,000 |
| Starting With Bluetooth Low Energy Development on iOS (2013) | 77,000 |
With few exceptions, these aren’t my personal favorites. But I guess they are positioned well in Google search results and are old enough to have accumulated lots of views.
Traffic sources
Over all time (April 2011–December 2017).
| Google search | 58 % |
| Direct/no referrer | 19 % |
| Stack Overflow | 4 % |
| 4 % | |
| Hacker News | 1 % |
| Daring Fireball | 1 % |
Languages
The primary language reported by visitors’ browsers in 2017.
| English | 75 % |
| Chinese | 4 % |
| German | 3 % |
| Russian | 3 % |
| French | 2 % |
Countries
The top countries where my visits came from in 2017.
| USA | 28 % |
| India | 9 % |
| UK | 5 % |
| Germany | 5 % |
| Russia | 4 % |
| Russia | 4 % |
| China | 4 % |
| Canada | 3 % |
| Ukraine | 3 % |
| France | 3 % |
| Japan | 2 % |
Operating Systems
In 2017.
| Mac | 73 % |
| iOS | 15 % |
| Windows | 10 % |
| Android | 2 % |
| Linux | 1 % |
Browsers
In 2017.
| Chrome | 48 % |
| Safari | 45 % |
| Firefox | 5 % |
| Internet Explorer/Edge | 1 % |
Desktop vs. Mobile
In 2017.
| Desktop | 84 % |
| Mobile | 13 % |
| Tablet | 4 % |
I’m a little surprised by the low percentage of mobile traffic, but I guess it matches how most visitors presumably find my site: from Google search results while trying to solve a particular problem at work.
Trivia
Best single day: Novemver 20, 2014. 47,000 page views, mainly because iPhone 6 Plus Pixel Peeping was on the front page of Hacker News.
Number of times fireballed: 4
Of which for a genuine article on programming: 0
Number of times my site went down due to a traffic spike: 0 (yay for static sites!)
Make your own site tracker-free
If you want to make your own site tracker-free, don’t forget about other potential tracking sources:
-
Don’t embed tweets, Facebook posts etc. with the official snippets provided by social media companies. Instead, copy and paste the text of the tweet and add a plain link.
I follow this policy strictly for tweets (see this article for an example), but admittedly I have used YouTube embeds occasionally in the past. I’ll reconsider this for the future. Most of the time, a plain link, with a preview image if necessary, is just as good.
-
Don’t use the official snippets provided by social media companies for embedding sharing buttons.
-
Host web fonts, stylesheets, and JavaScript helpers such as jQuery yourself.
-
Consider turning off referrer information so as not to leak the URL of the requesting page to third-party servers when loading embedded content. This can be done either with a HTTP header or a
<meta>tag your HTML.
I think we should all do our part in minimizing the amount of data we give the big companies for free. I know this is often difficult, but this also applies to analytics packages etc. in apps.