Update January 27, 2012: Apple recently posted some new videos to its developer site. One of them, titled Optimizing App Performance with Instruments is presented by Michael and follows the contents of his Tech Talk presentation pretty closely. It’s worth watching, especially for all the Instruments demos he is doing. See my blog post about the new videos on where to find them.
The last Tech Talk session I am going to write about here is Michael Jurewitz’s talk titled Your iOS App Performance Hitlist:
The best iOS apps are not only beautiful and well designed, they also launch quickly, present a highly responsive interface, and use memory efficiently. Master the techniques to diagnose and fix common performance problems before your customers see them. Learn the performance hit-list you should apply to every one of your apps before it goes out the door.
In this session, Michael gave us a hands-on introduction on how to identify performance problems with Instruments based on three common problem areas. Overall, I liked this talk the best. I had seen sessions on Instruments before but sometimes you have to see things demo’ed two or three times until the learning kicks in. And I definitely feel that I learned a few new tricks here.
General Tips
The number one technique for measuring performance is to actually measure it. Don't guess!
Guesswork is almost never the right approach to performance optimization. It’s hard to optimize problems that you haven’t measured so the latter must always be your first priority. Apple provides Instruments to quantify different aspects of your app.
Another important factor is to test your app under realistic conditions. If you just test your app with a fresh developer build that contains little or no test data, it is very likely that you won’t catch many serious performance and memory problems that will later plague your users. You should always make sure to use realistically-sized data sets for your tests and make sure to also test the worst case. After all, users that manage large amounts of data with your app are often your best customers and you don’t want to offend them.
For the remainder of the talk, Michael focused on the following three performance characteristics:
- Launch Quickly/Avoid Blocking Work
- Minimize Memory Usage
- Draw Efficiently
In his words, if you optimize these, you’re probably more than half way there on the road to a well-performing app.
1. Launch Quickly
Ask yourself, is this operation essential for loading the most basic main UI? If not, defer it.
Many iOS apps are used for just a few seconds at a time and (even in times of multitasking) relaunched very often. Nothing is more frustrating to the user than having to wait for several seconds each time an app is launched until she can get started interacting with it.
Your goal should be for your app to be ready for user input as quickly as possible. If that means that some UI components (e.g., images or web content) have not yet loaded completely, no problem. It is much better to already display a content-less UI than forcing the user to wait until everything is 100% complete.
To minimize your launch time, try to identify the minimum possible stuff your app must do in all methods that can get invoked before your app’s UI is ready:
application:didFinishLaunchingWithOptions:applicationWillEnterForeground:applicationDidBecomeActive:application:openURL:sourceApplication:annotation:application:didReceiveRemoteNotification:application:didReceiveLocalNotification:- Your root view controller’s
initandawakeFromNibmethods viewDidLoadandviewWill/DidAppear:, also in your your root view controller
Your main focus should probably be on application:didFinishLaunchingWithOptions: and viewDidLoad.
Common problems you should look out for are synchronous network calls and the synchronous loading or parsing of large data sets such as huge data files or images. dispatch_async() should be your biggest friend here. You should never block the main thread with a synchronous operation that could potentially take a long time (more than a few tenths of a seconds or so) to complete, much less so during your app’s launch phase. Try to push these operations onto background queues from where you notify the main queue once the operation has finished. Until then, display a progress indicator in your UI.
Instruments: Time Profiler
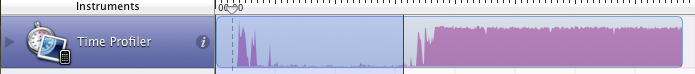
To identify problems of this kind with Instruments, use the Time Profiler instrument. While your app runs, Instruments will continuously sample the process and record the code’s current position in the call stack, thereby identifying the methods your app spends the most time in.
When you have collected enough data, stop the recording. Your goal is now to find the most time-consuming methods in the Call Tree and try to optimize them one by one. Here are a few of Michael’s tips:
-
During the recording, place flags in the timeline to identify events such as the end of the launch process.
-
Before looking at the Call Tree, always define an Inspection Range, using the buttons in the toolbar. Use the flags you have placed during recording to identify the section of your code you want to analyze.
-
Uncheck the Invert Call Tree and Hide System Libraries options. The former makes it easier to understand the call tree (though it might take you a little longer to click through to the offending method) and the latter shows you time-consuming method calls in the system frameworks. If you decide to hide those, you might overlook an ill-placed synchronous network call that increases your launch time by several seconds.
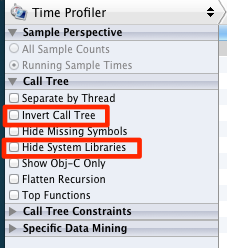
Time Profiler options. -
Now it is time to explore the call tree. Starting with
main(), click yourself through the tree until you reach your own code (often more than a dozen levels deep in the tree) and try to find the methods that take up a large percentage of the total time. Open the Extended Detail View to see more info about the selected line or double-click one of the methods in your code to jump directly from Instruments into the code.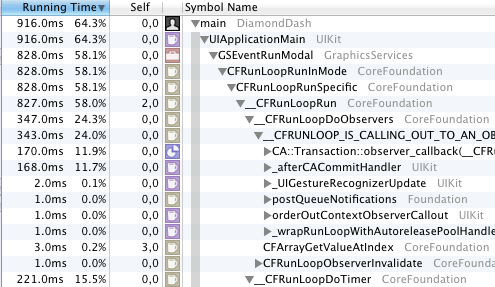
Time Profiler Call Tree. -
Pay special attention to the Self column. It tells you how much time was actually spent right inside that method as opposed to methods further down the stack that the selected method has called. A high percentage in Self often indicates a problem in your code such as a long-running loop.
-
Rule of thumb: At best, launching your app should not take more than 2-3 seconds. If your own code’s percentage of the total launch time exceeds 20-30%, that could indicate a problem.
2. Minimize Memory Usage
Optimizing memory usage has been with iOS developers from the beginning. Because iOS devices have no swap file, there is a hard limit on the memory the system can use. If apps require more memory than is available, the OS has no other choice than to kill one or more apps, starting with (but not limited to) those that are currently in the background. There is another incentive to use as little memory as we can: the less memory your app uses, the longer the OS will keep it alive in the background, which means a better experience for your users.
In iOS 5, if your app is the frontmost app and we send you a memory warning, it means that your head is already on the chopping board.
To notify you of memory pressure, the OS can send a memory warning to the active app. Michael noted that he got the impression that, with the introduction of multitasking in iOS 4, many apps got a bit lazy when it comes to dealing with memory warnings. After all, if the frontmost app did not free any memory in reaction to a memory warning, the OS still wouldn’t kill it as there were usually several apps frozen in the background that could be killed first. And this is indeed the behavior in iOS 4. Because of these unintended consequences, Michael stressed that Apple has made changes in iOS 5: In iOS 5, if your app is the frontmost app and we send you a memory warning, it means that your head is already on the chopping board.
So you better do something about it and react to those memory warnings!
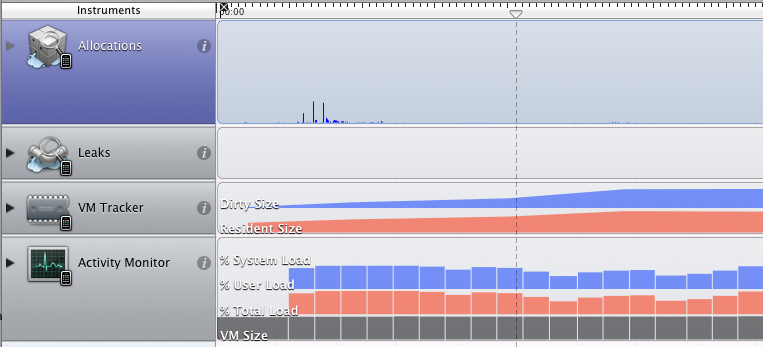
Instruments: Allocations + Leaks + VM Tracker + Activity Monitor
Michael has constructed his own combination of instruments to measure an app’s memory usage by combining the Allocations, Leaks, VM Tracker and Activty Monitor instruments. It’s easy to do this yourself by creating a blank instrument and dragging the four mentioned instruments from the Library inspector pane into the main window. You can then save this instrument as a template for reuse.
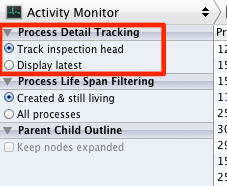
The Activity Monitor can be used to compare your app’s resource usage to other apps that are currently in the background. For example, sort the app list by Real Memory and select the Track inspection head option. When you now drag the inspection head across the timeline you just recorded, you will see your own app rise (or fall) among the other backgrounded apps depending on how much memory you use.
The Allocations instruments can be misleading because it does not show you all of the memory your app is using (only the malloc-type allocations). Still, you should watch out for the following patterns:
-
A constantly growing allocations chart is obviously a bad sign. It usually indicates some pretty severe memory leaks. If you don’t fix this problem, your app will crash sooner or later because it runs out of memory.
-
When you repeat the same action in your app over and over again (for example, switch to another screen and then go back to the first screen), your memory usage should not increase. On the allocations chart, you would usually see an increase the moment you start the action (because a new view has to be created) and a decrease soon after going back to the starting position, especially when you repeat this action for multiple times.
If you see none or only part of the memory being reclaimed, it is a sign of a leak or a block of abandoned memory, possibly caused by a retain cycle. Use Instrument’s Heapshot Analysis to track these problems down. By clicking Mark Heap between repeating the same action, Instruments can show you exactly which objects did not get freed. Looking at the list can usually get you on the right track.
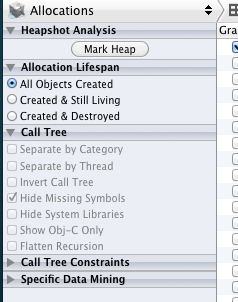
Heapshot analysis options for the Allocations instrument. -
Large memory spikes can cause the system to evict read-only pages from memory because the OS knows it can read them back later from disk. Because your app’s code is also part of these reloadable read-only pages, a large memory spike, even for just a few milliseconds, can cause your app to stutter when the system evicts and later has to reload your app’s code. Try to avoid them if you can.
VM Tracker, *Dirty*/Resident Size offers the most accurate view of the real memory your app is using.
The VM Tracker instruments is useful because it can show you the real amount of memory your app uses. The two columns, Resident Size and Dirty Size, show the amounts of memory that can be mapped out to disk or not be reclaimed, respectively. According to Michael, the amount shown in the *Dirty* row and Resident Size column is the most accurate view of the memory your app is using at the point that is currently selected in the timeline. Don’t be stunned if this is radically different from the value that is indicated by the Allocations instrument.
3. Draw Efficiently/Inefficient Drawing
Rule of thumb: if more than 50% of the screen area is made up of transparent layers, scrolling will likely begin to stutter.
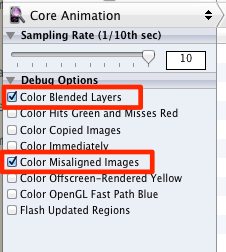
The Core Animation instrument can help you identify performance issues in your drawing code. By color-coding the layers in your app’s UI, you get a quick at-a-glance overview how you are doing.
Even if your app’s UI just consists of plain UIKit controls and you don’t actually draw any content yourself, it is possible to make mistakes that can significantly affect performance, especially during scrolling. According to Michael, you should especially watch out for:
-
Too much transparency: Non-opaque layers make the blending work for the GPU a lot harder so you should avoid them whenever you can. Sure, there are many nice effects that rely on transparency, from drop shadows to rounded corners, but at the end of the day your users will probably appreciate an app that scrolls without stutters more than one that looks a little prettier but doesn’t scroll smoothly.
Michael especially stressed the construction of text labels in custom table cells. Most labels can stay opaque with a fixed background color because the table view will actually take care to switch the background color when the cell is selected. And if you do need transparency, at least make sure that two transparent labels do not overlap (which multiplies the work for the GPU).
The Core Animation instruments highlights transparent layers in red (bad) and opaque layers in green (good).
-
Drawing scaled content: Scaling images causes extra work for the graphics system that can usually be avoided by making your app’s resources the correct size. If your app downloads dynamic content from the web, it probably makes sense to downscale images programmatically to the exact size in which they are displayed.
The Core Animation instrument highlights scaled content in yellow. Not all scaling is bad, though. The Core Animation instrument will also highlight many standard UIKit elements such as navigation bars and tab bar because they use stretched images for their backgrounds. That is absolutely fine.
-
Drawing pixel-misaligned content: Although the coordinate system in Core Graphics uses floating point units, these coordinates have to mapped to a device’s fixed pixel grid before they are displayed. Make sure to draw your content on integral coordinates to avoid aliasing work for the graphics system, which both costs performance and makes your graphics look bad. The Core Animation instrument highlights misaligned content in magenta.
Also have a look at Cyril Godefroy’s blog post about the same talk at the iOS Tech Talk in London.
Update November 18, 2011: Benjamin Godard also blogged about this last part of the session. Look at the screenshots in Benjamin’s post to see what to watch out for.